 LandOffer
Job search
Data Analyst Resume: Turn SQL, Dashboards, and Analysis into Evidence
Turn SQL, dashboards and analysis into evidence of a useful decision. Trace metric definitions and query checks, then write resume bullets that accurately describe your contribution.

A data analyst resume should explain what your query, dashboard, or analysis established. Name the metric, its definition, the data check you completed, and the decision or handoff it supported. SQL and BI tools help identify your technical background, but a list of tool names cannot show whether you understood the number on the screen.
LandOffer publishes this guide and offers job-search tools. Start with a role whose analytical responsibilities fit your work. You can browse recent roles on LandOffer.ai, then match its reporting or investigation requirements with evidence you can explain. This article uses a completed fictional reporting exercise and official technical documentation. The example's numbers are teaching inputs, not real professional results.
Describe the question behind the dashboard
“Created a dashboard in Power BI” describes a deliverable. It does not explain why the deliverable was needed, which definitions you chose, or whether its numbers were reliable. A better account starts with the question: which orders count, which refunds belong to them, or why two reports disagree?
Recover the request, metric definition, query, and review notes before drafting a bullet. Identify the person or team using the output. Then identify your contribution: defining a measure, reconciling a discrepancy, building a repeatable query, or explaining a limitation. Each can be useful evidence without an invented revenue increase.
The definition and check show what your analysis established. A hiring reader can understand the work when the metric and the check are specific. “Improved data quality” is much less informative than explaining that a join duplicated orders with multiple refunds and that you corrected the aggregation level.
The responsibilities in an analyst opening can vary. Some roles center on operational reporting, others on investigation, stakeholder interpretation, or data modeling. Use the posting to select relevant work. Do not turn a reporting example into a predictive-model or experiment-design claim merely because those terms appear elsewhere in the data field.
A completed metric and query reconciliation
The following fictional case concerns Felix Park at the invented Sable Kitchen. A manager needed an order-cohort report showing gross order value, refunds associated with those orders, and net value. This original teaching example uses a tiny synthetic ledger so every number can be checked. It is not a real business account.
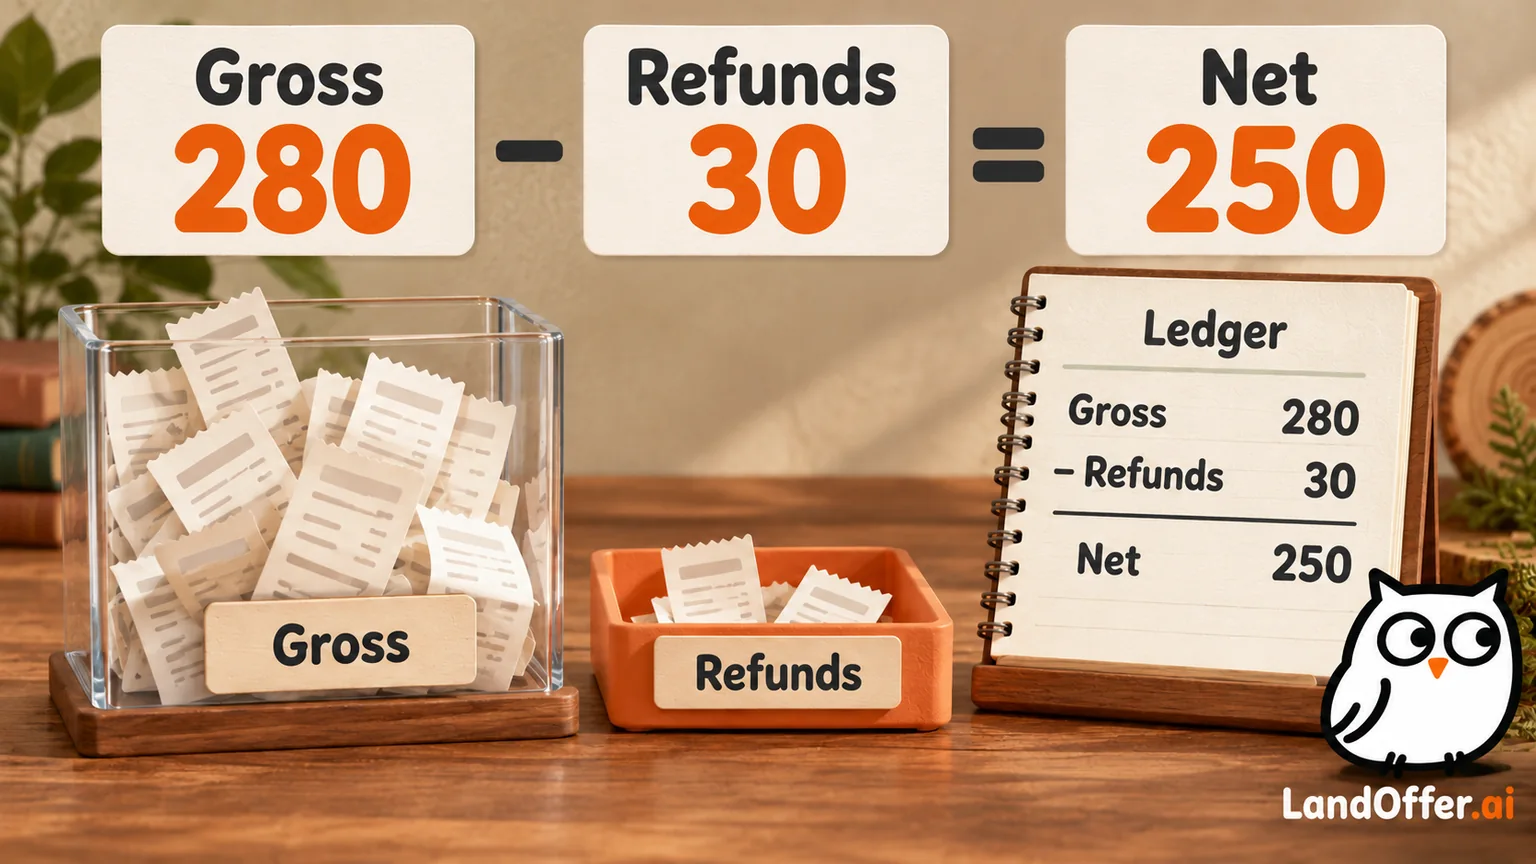
The assumed definition includes four completed orders in the selected period, with values of forty, sixty, eighty, and one hundred units. Two refunds of twenty and ten units both belong to the eighty-unit order. All example refunds fall inside the exercise's stated reporting boundary. There are no taxes, cancellations, currency conversions, or late-arriving records in this small dataset.
| Order | Order value | Associated refund records | Net order value |
|---|---|---|---|
| A | 40 | None | 40 |
| B | 60 | None | 60 |
| C | 80 | 20 and 10 | 50 |
| D | 100 | None | 100 |
| Total | 280 | 30 | 250 |
The first query left-joins orders directly to individual refund records and sums order value afterward. Order C appears twice. The joined gross value becomes three hundred sixty, because the eighty-unit order is repeated. That total describes duplicated joined rows, not the agreed order cohort.
The completed correction aggregates refunds to one row per order before joining them. Now each order contributes once. Gross value is two hundred eighty, refunds are thirty, and net value is two hundred fifty. Felix's contribution is a definition and reconciliation that the manager can inspect, rather than a claim that the company earned more money.
Show the query choice and its result
Here is the corrected query for the fictional ledger:
WITH refunds_by_order AS (
  SELECT order_id, SUM(amount) AS refund_value
  FROM refunds
  GROUP BY order_id
)
SELECT SUM(o.order_value) AS gross_value,
       SUM(COALESCE(r.refund_value, 0)) AS refunds,
       SUM(o.order_value - COALESCE(r.refund_value, 0)) AS net_value
FROM orders AS o
LEFT JOIN refunds_by_order AS r ON r.order_id = o.order_id;
The query is useful because the aggregation level follows the metric definition. It retains orders without refunds through the left join and treats their refund value as zero. The corrected query was run locally on the stated synthetic inputs and returned gross 280, refunds 30, and net 250. That check is not a production SQL or performance review.
PostgreSQL's join documentation explains how matched rows are combined, while its aggregate-function documentation describes grouping and aggregation. Those technical rules provide context for the exercise. They do not prove that a particular company's schema or report has the same problem.
For your own work, find the grain before quoting a result. Is each row an order, item, payment, event, customer, or account? A one-to-many relationship can change the meaning of a sum. A count of rows is not automatically a count of the business entity the stakeholder intended.
You do not need to paste SQL into a resume. The resume should carry the choice and result; a portfolio or interview can carry the query. For Felix, the resume needs the order-cohort definition and duplicated-refund correction; the supporting notebook can carry the SQL. Preserve enough context that the public bullet remains accurate even when the reader never opens the supporting artifact.
Rewrite a tool-centered bullet into evidence
Felix's first draft says:
Built SQL queries and Power BI dashboards to improve revenue reporting.
The completed rewrite says:
Defined an order-cohort net-value measure and corrected a refund join that duplicated multi-refund orders; reconciled the query to a synthetic review ledger before handing the definition to the reporting team.
For this teaching case, the review ledger is synthetic, so the bullet says so. In a real resume, replace that setting with your actual approved evidence. Do not copy Felix's fictional employer or imply the exercise was paid work.
A second possible description focuses on interpretation:
Documented the report's order-cohort boundary and explained why refund totals differed from a refund-date report, enabling the manager to choose the appropriate view for the question.
That second statement needs a corresponding explanation in the project record. Here the fictional definition note explicitly compares an order cohort with a refund-date view. It does not claim the two reports should always match. Different date boundaries can produce different valid answers.
The revised description makes the interpretation work visible. The actual value comes from giving the reader a completed analytical action and its bounded consequence. Felix did not grow revenue; Felix helped the manager interpret a measure correctly. Those are different achievements.
Explain definitions and boundaries without overwhelming the reader
Metric definitions can demonstrate judgment when they change the answer. Important boundaries may include status, time zone, event date, cohort, eligibility, or exclusions. Select the one that matters to the problem. Avoid stuffing every field into one dense sentence.
For example, order date and refund date answer different questions. A report about orders placed during a period may include later refunds for that cohort, depending on its definition and as-of date. A report about refunds issued during a period can include orders from earlier periods. Neither is inherently wrong; they cannot be treated as the same metric.
The Sable exercise deliberately uses refunds inside the stated boundary so the arithmetic stays simple. A real report may need late-data handling, multiple currencies, or cancellation rules. Describe only the complexity you actually addressed. Do not expand a small exercise into an enterprise-wide reporting claim.
Keep the full definition in an internal evidence note. The resume can say that you standardized the cohort boundary or reconciled two date-based views. An interview can explain why that mattered and how you confirmed it with the stakeholder. If the stakeholder rejected your definition, describe the investigation and agreed revision instead of claiming ownership of the final metric.
Connect a dashboard to interpretation and maintenance
A dashboard can involve more than selecting chart types. You may have mapped a measure to a question, exposed an as-of timestamp, documented filters, checked a relationship, or made a refresh failure visible. Name the work that made the report usable or trustworthy.
Microsoft's Power BI star-schema guidance discusses fact and dimension tables and model grain. It is tool-specific technical guidance. Use it to understand your model choices; do not infer that every BI system has the same relationship behavior or that a particular schema guarantees accuracy.
If you worked on a semantic model, explain the relevant relationship or measure you changed. If you only consumed an existing model, focus on the analysis you performed. A visualization built on someone else's curated data does not establish that you designed the upstream warehouse.
Maintenance can show how you kept a report usable after its first delivery, when that work was part of your responsibility. A documented refresh check, an accepted metric definition, or a reporting handoff can be a completed result. Viewing a dashboard once cannot support a claim that you maintained its reliability over time.
For a portfolio, include the question, small approved or synthetic inputs, query, expected result, and interpretation. Use a readable explanation rather than a screenshot with unexplained totals. Private customer records should not appear merely to make a project seem more authentic.
Use numbers only when their meaning is recoverable
Analyst resumes often benefit from numbers, but the numbers must come from the work. A percentage reduction in reporting time needs a baseline, a comparable measurement, and your role in the change. A dashboard's user count needs a defined usage measure. A business outcome needs an attribution account.
If no such measurement exists, state the verified deliverable or decision. “Reconciled the monthly report to the approved ledger” can be stronger than an unsupported claim that reporting accuracy improved by a large percentage. Completed review is evidence; invented precision is not.
For Felix's exercise, the only numeric results come from the synthetic inputs and arithmetic. The correction changes an erroneous computed total, not the underlying orders. No professional claim is made that a real company gained eighty units or improved profit because of the query.
When confidentiality prevents publishing a value, describe the check without revealing it. Do not invent a replacement number and present it as measured. An approved anonymized example should state its status, and a synthetic example should be labeled at first appearance.
Pick verbs that match your contribution
“Analyzed,” “defined,” “reconciled,” “built,” and “documented” describe different actions. Use the one your records support. “Led” requires a leadership account; “increased” may imply a causal outcome; “owned” needs a clear responsibility boundary.
Harvard's resume guidance supports specific, fact-based writing. The facts still come from your own work. Career guidance does not establish a company's metric, your contribution, or the outcome of its hiring process.
For a collaborative project, distinguish your query change from the data engineer's ingestion work and the stakeholder's operating decision. That makes the story clearer. You can show collaboration without pretending you designed every part of the system.
The same rule applies to coursework. A class dashboard can demonstrate grouping, relationship checks, and interpretation. Label it as coursework and describe the actual analysis. Completing a tutorial does not become employment experience when a more professional-looking verb is added.
Choose one metric to improve the resume
Review one target posting and select a reporting or investigation requirement. Find a true example where you defined a number, checked a query, or explained a discrepancy. Draft the bullet around that action and its documented consequence. Keep the tool names where they help identify the technical work.
You can explain the number and your contribution without relying on an impressive tool list. A clear definition and checked result give you something concrete to discuss. Browse recent roles on LandOffer.ai, choose one relevant metric from your own work, check its definition and review record, and rewrite its bullet to show what you established.
Sources and Further Reading
- PostgreSQL joins: matched rows and joins.
- PostgreSQL aggregates: grouping and aggregate results.
- Power BI star-schema guidance: fact, dimension and grain concepts.
- Harvard resume guidance: specific writing.
Evidence checked October 8, 2026. Felix and Sable Kitchen are fictional. Ledger amounts and example records are synthetic teaching inputs.